
Supply Chain Platform
Redesign to improve shipment tracking and visibility
1
Project details
- Product: Shipment module | B2B enterprise solution
- Role: Product designer
- Team: Product lead (Michael), Senior product manager(Su Xian), Developers
- Tool: Figma, Confluence, Jira, Miro
2
Deliverables
- UX research
- UI mockups
- Design handoff to developers
3
Introduction
As part of an integrated supply chain platform, the shipment tracking module is a core interface used daily by logistics teams, customer service, and end clients. However, user feedback revealed that the existing design often caused confusion and delayed responses. We took on the challenge to redesign this module to improve clarity, usability, and efficiency across various user personas.
5
UX research phase
We gathered insights through surveys, product feedback, and recorded support queries to understand recurring user pain points. In addition, I also conducted a usability heuristics evaluation on the existing shipment module screens to identify UI design violations such as lack of visibility of system status, poor feedback, and failing to maintain internal consistency.

UX Surveys
We conducted CES (Customer Effort Score) and NPS (Net Promoter Score) surveys targeting users of the shipment module to better understand their satisfaction levels and perceived ease of use.
CES Survey:
A total of 21 respondents participated. The scale ranged from 1 (very difficult) to 7 (very easy).
63.9% of users rated the experience as somewhat easy to very easy (scores 5–7), suggesting the module was functional but not seamless.
Written feedback from lower scorers pointed to confusing filtering options, unclear shipment progress indicators and ETA.
Net Promoter Score (NPS)
This survey assessed 21 respondents’ likelihood of recommending the platform:
Promoters (score 9–10): 33% (7/21)
Passives (score 7–8): 38% (8/21)
Detractors (score 0–6): 29% (6/21)
NPS is calculated by subtracting the percentage of detractors from the percentage of promoters (% of promoters – % of detractors).
NPS =33%-29%= 4, it means that:
We have slightly more Promoters than Detractors, but only by a small margin.
The overall customer sentiment is neutral to slightly positive, but not strong.
This score suggests that the users’ experience is not bad, but there’s significant room for improvement to turn more users into promoters.
Key insights derived:
Users appreciated the functional aspects of the module but felt it was not intuitive.
Filters were fragmented across the UI, increasing cognitive load and making it difficult for users to quickly refine results.
Shipment status indicators lacked clarity, leading to frequent user confusion.
Survey results validated pain points and guided design priorities in the next phase.

Individual package model & Segment-Based Shipment Routing
As part of the redesign, we also had to accommodate the ‘shipment’ and ‘segment’ new concepts in shipment routing. By redefining a shipment as a single physical unit rather than a collective order, we transitioned the platform toward a more granular data structure. The new approach breaks down a shipment journey into multiple segments, each representing a leg in the overall route.
The change had significant implications for both the data structure and the UI interaction model:
- Hierarchical Clarity: The UI needed to clearly communicate the hierarchical relationship between the parent order, the individual package, and the status of each specific segment.
Operational Precision: Design components were adapted to surface critical physical attributes—such as weight and dimensions per package—ensuring accuracy across multiple legs and carriers.
This redesign ensured that logistics teams could accurately monitor and manage each part of a shipment, even when it involved multiple carriers or transport modes.
4
Problem Statement
As the business pivoted to an individual package model with multi-segment routing, the legacy interface became a bottleneck.
Data Fragmentation: Critical physical details (dimensions, weights) were buried under order-level metadata.
Static Logic: A rigid 3-stage progress bar failed to represent the reality of shipments with 3, 5, or more journey segments.
- High Interaction Cost: Scattered filters and search tools increased cognitive load and delayed time-critical decisions.
5
Goal
Redesign the Shipment management experience to move from static tracking to operational precision. The goal was to create a scalable, segment-aware UI that prioritizes real-time physical data and unifies fragmented controls into a single, intuitive workspace.
6
UI Design
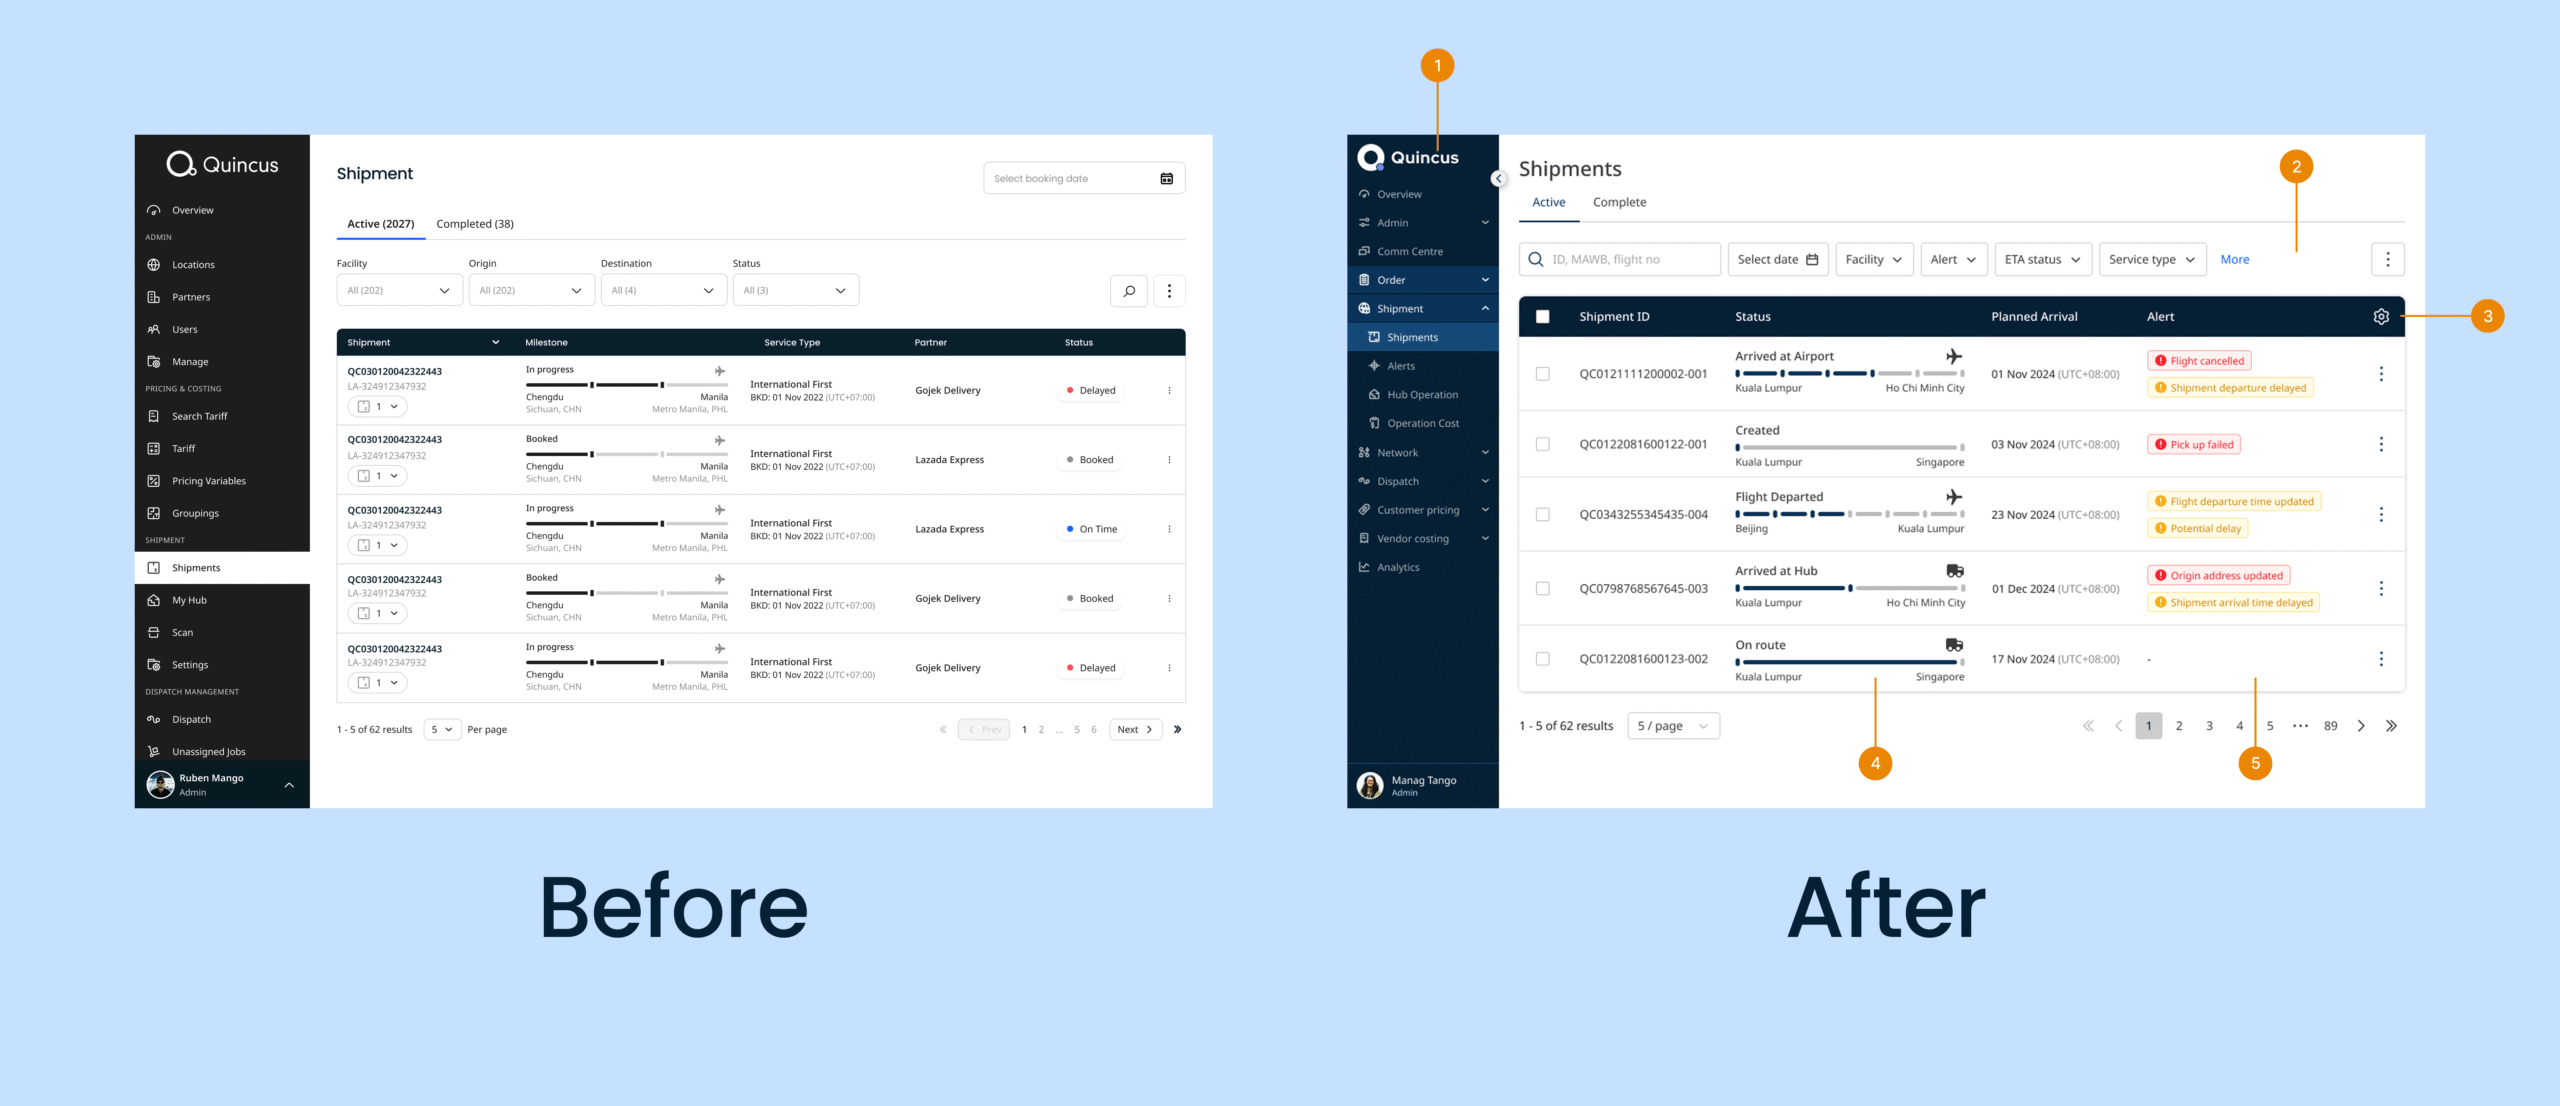
Shipment management page
The Shipment Management Page is the central operational hub for Logistics Operation Managers. Unlike a static list, this workspace is designed for exception-based management, allowing managers to oversee the end-to-end lifecycle of active shipments in real-time.
- 1. The sidebar changes from a flat, overwhelming list of items to a structured, collapsible menu using Progressive Disclosure. By grouping related functions (e.g., "Order," "Shipment," "Network") into accordions, the user only interacts with the tools they need for their current task. This declutters the workspace and reduces cognitive load, allowing the manager to focus on the data rather than navigating the tool.
- 2. We consolidated the search, date selection, and multi-category filters into a single, cohesive unit directly above the results table. By placing the Search bar and Filters in one line, we reduced the distance the mouse (and eye) had to travel, making the refinement process feel instantaneous. Recognizing that shipment-centric data is complex, we added a "More" dropdown to keepsthe primary UI clean for 80% of tasks while allowing power users to access niche filters without cluttering the header.
- 3. Adding a settings icon (gear) to allow users to customize columns and table density. Providing a customizable view empowers the user to build their own command center, ensuring that the most relevant data points for their specific role are always visible without creating a cluttered UI for everyone else.
- 4. The redesign of the Shipment Status View represents a transition from a simplified tracking model to a dynamic segment model. In Before UI, every shipment followed a rigid 3-status logic (Booked → In Progress → Delivered). While clean, this was deceptive for complex logistics. A cross-border air-freight shipment was visually treated the same as a local bike delivery. Hence the progress bar in After UI is now programmatically driven by the route segments with a variety of real-time statuses. If a shipment has 4 segments (e.g., Trucking → Air Freight → Trucking → Last Mile), the UI reflects 4 distinct portions. This ensures the "Source of Truth" in the database accurately reflecting the complexity of the journey.
- 5. Introducing a dedicated "Alert" column with color-coded status pills (e.g. Pick up failed, Potential delay). Using semantic colors (red for critical, yellow for warnings) leverages Visual Salience, ensuring that urgent issues catch the manager's eye immediately, thereby reducing the "Time-to-Resolution."
TL;DR: Summary
|
Feature
|
Design Strategy
|
User Benefit
|
|---|---|---|
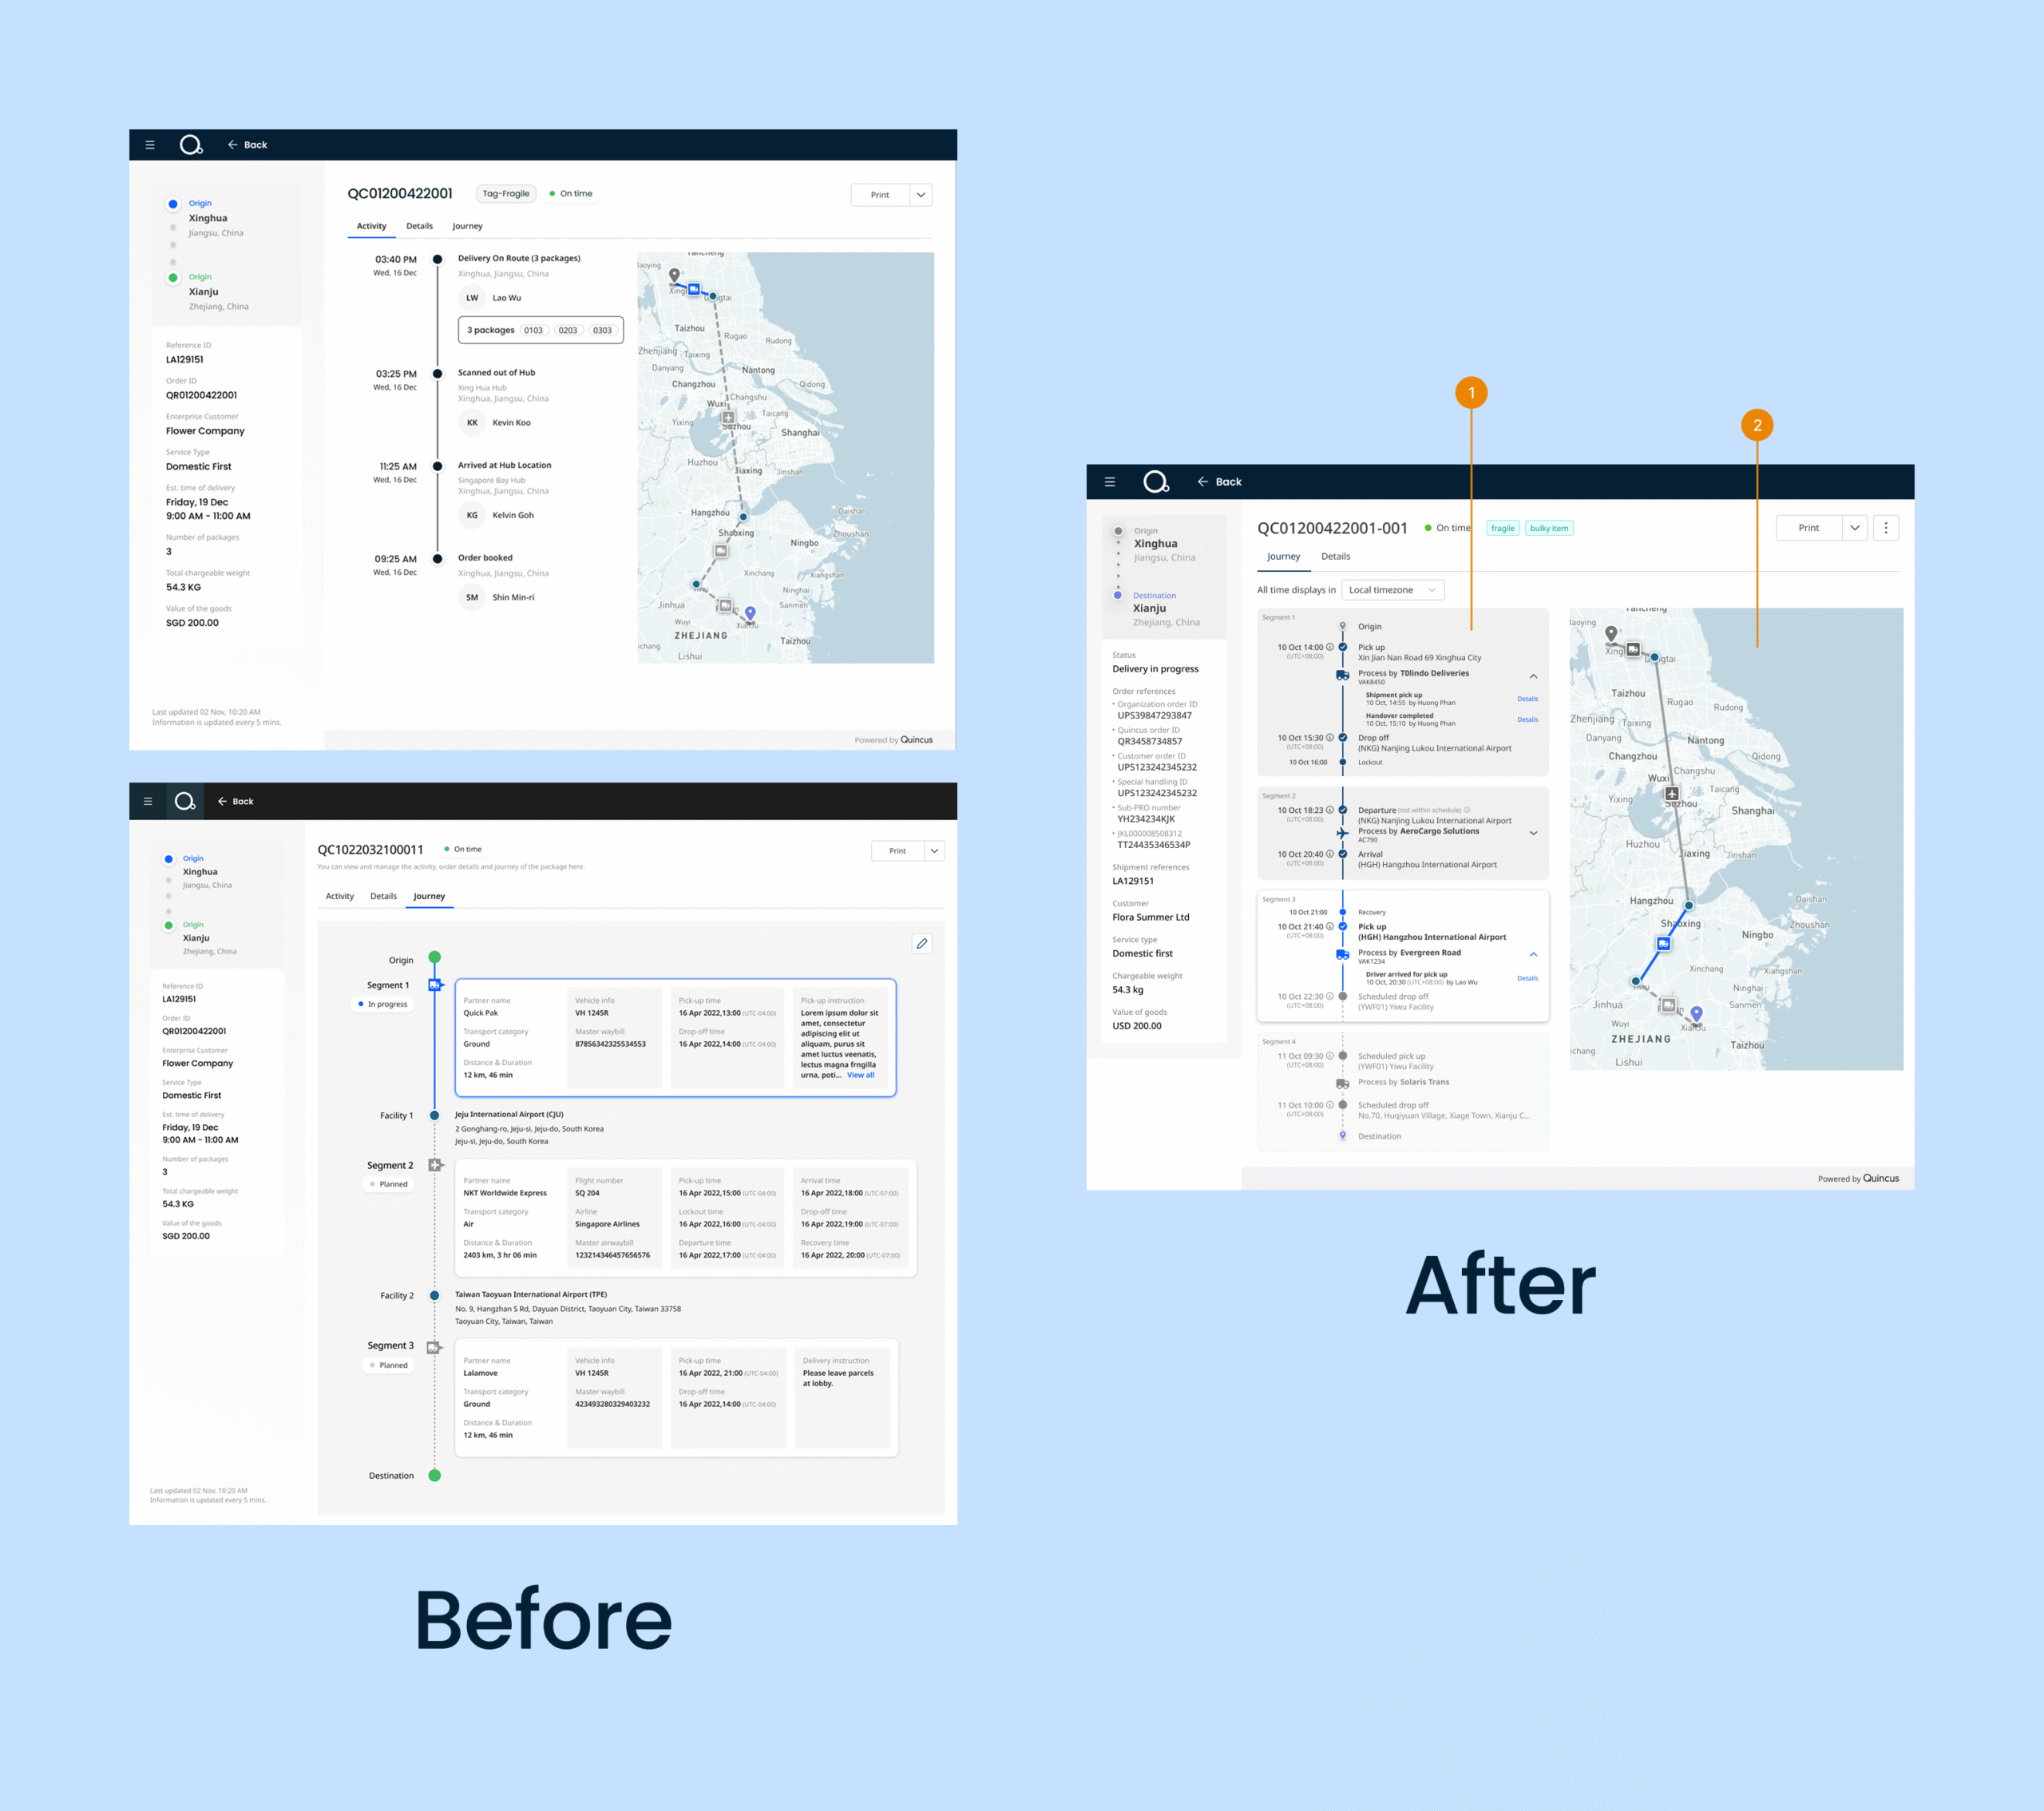
Merging the Activity and Journey pages into a single, unified view
In the “Before” version, the user had to jump between tabs to understand the planned journey vs. the actual progress. This required them to hold information in their short-term memory (cognitive load). By combining them, we created a Single Source of Truth so the user can now see where the shipment was, where it is, and where it is going next in one continuous visual flow. In addition, the “Before” layout was either too sparse (top left) or too cluttered with large boxes (bottom left). The “After” design uses Progressive Disclosure within each segment (e.g., the “Details” dropdowns). This keeps the high-level status glanceable while allowing the user to “drill down” into specific partner info or vehicle numbers only when needed.
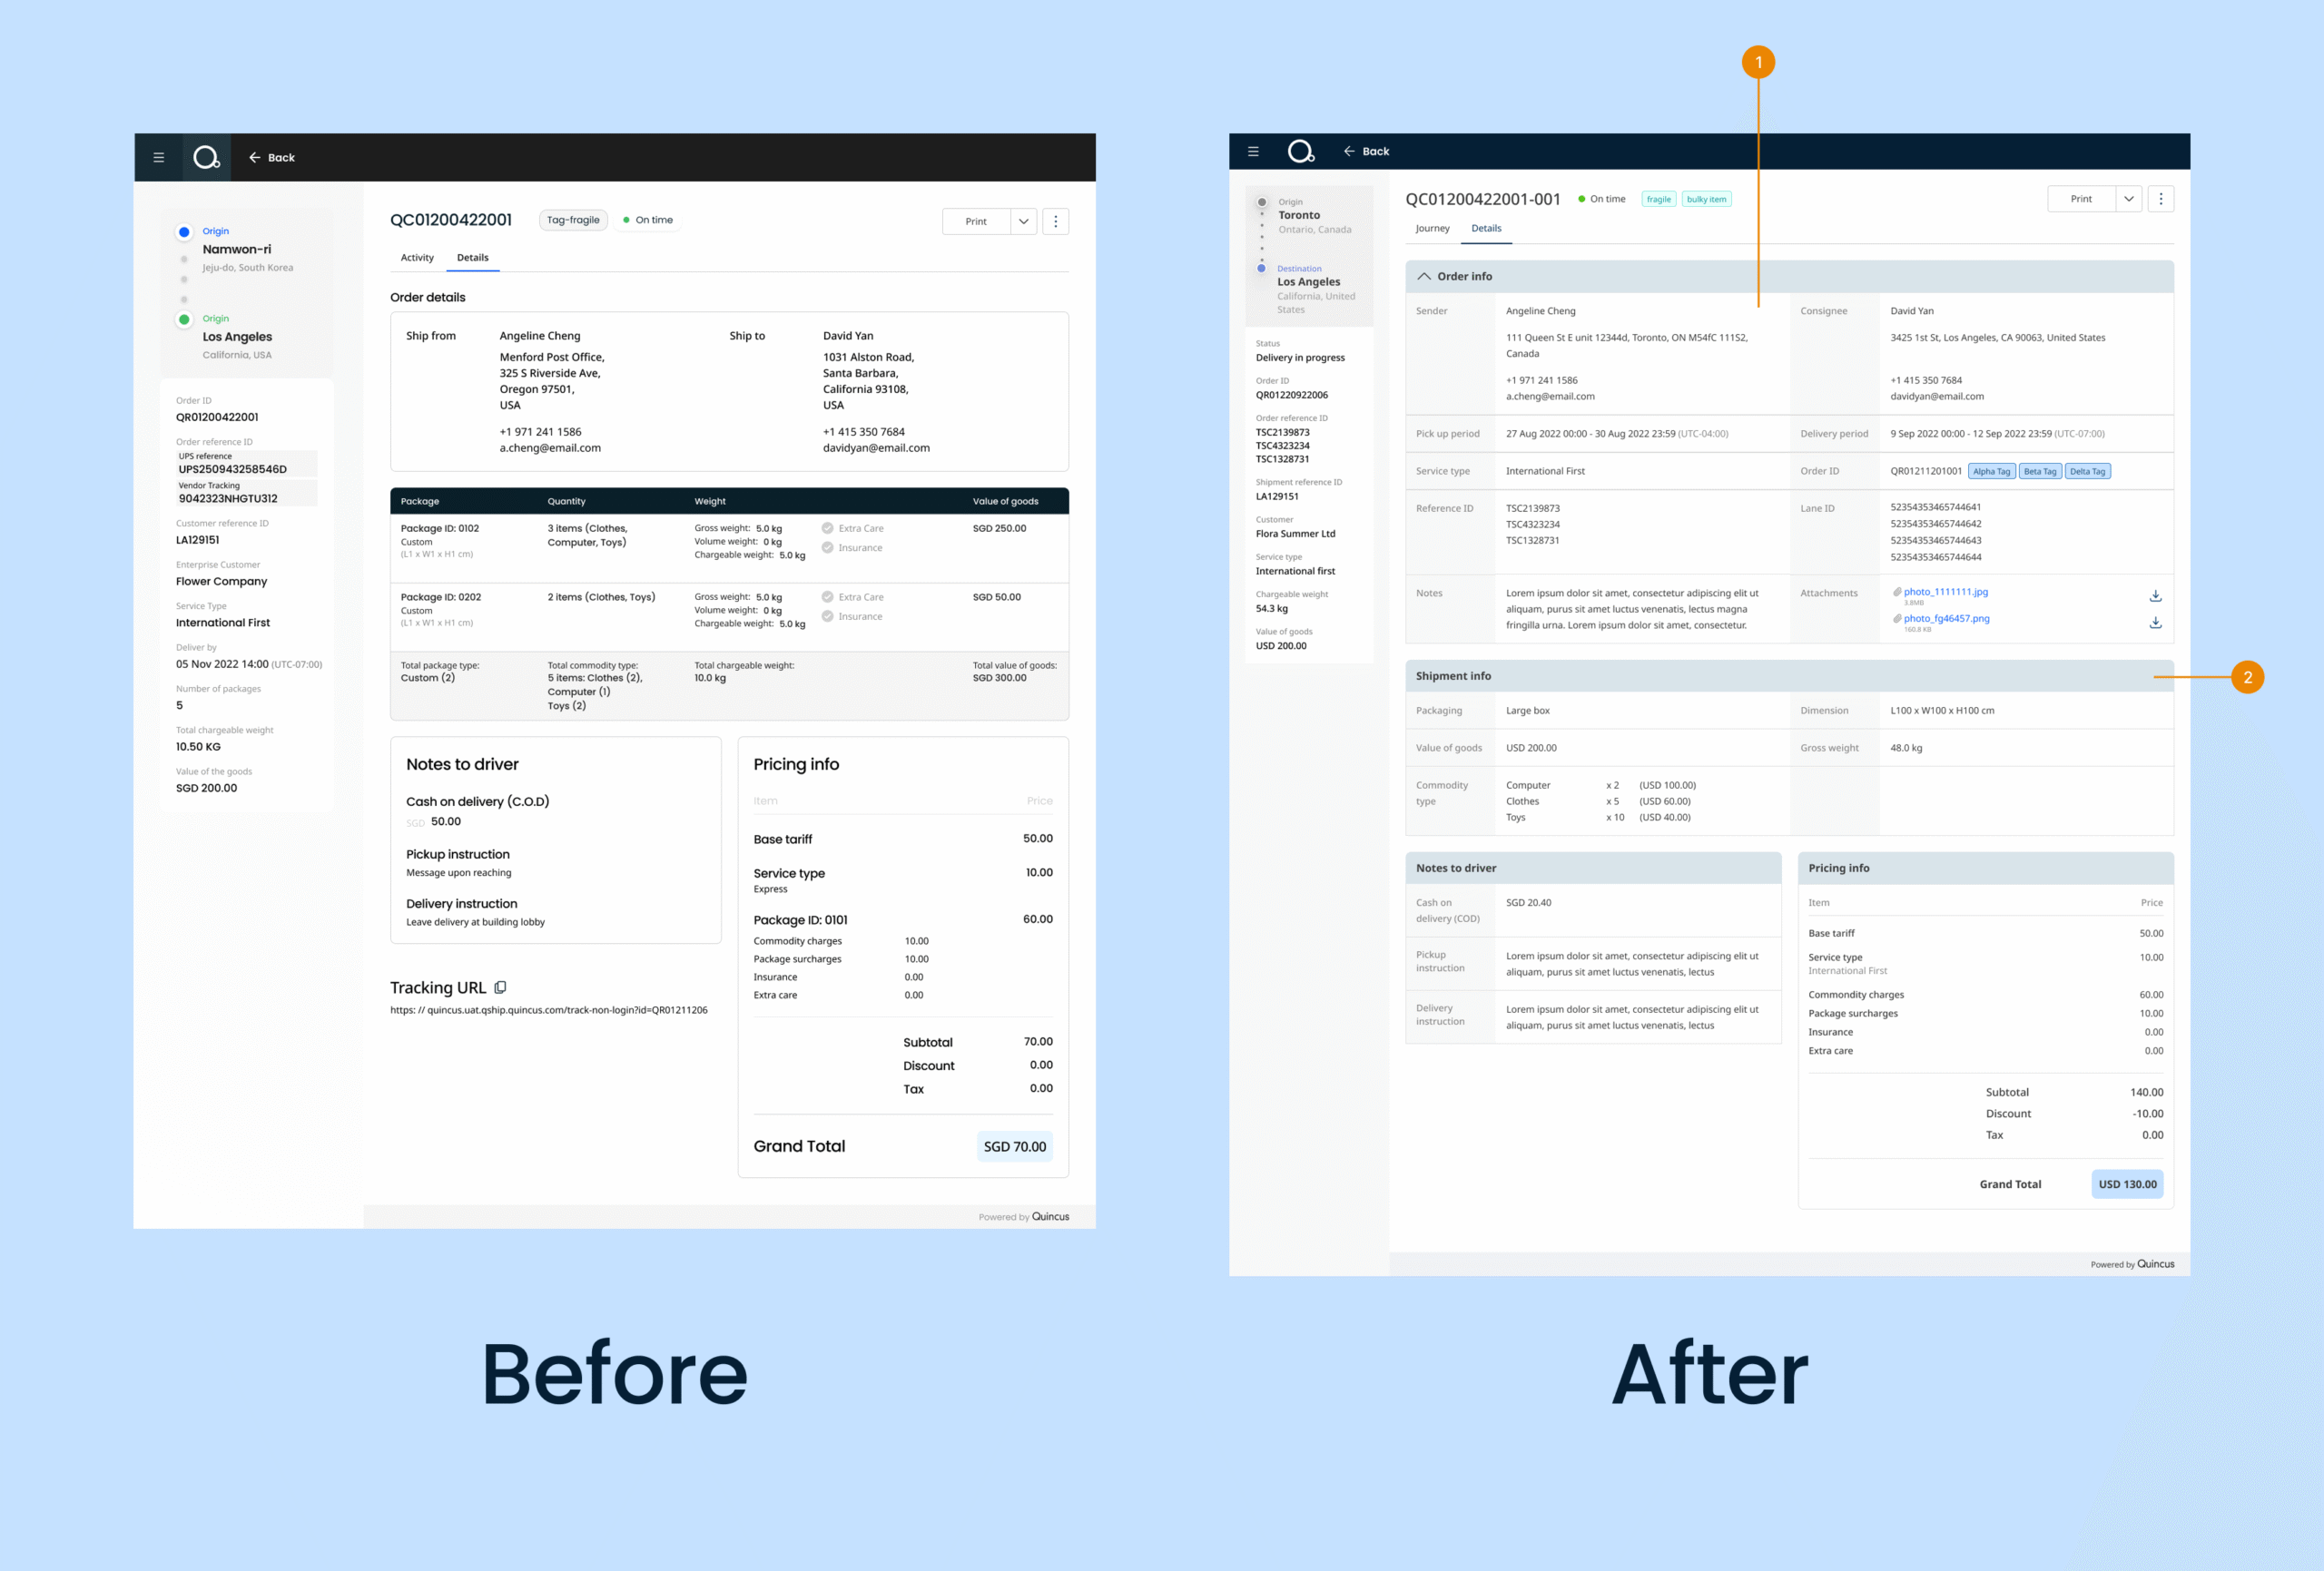
Shipment info page
There was a massive pivot made by the product management team, which is redefining the primary key (shipment) of the entire logistics database. Moving from one-to-many relationship (1 Shipment: N Packages) to one-to-one (1 Shipment = Individual Package) led to some major design changes in UI.
- 1. Information Hierarchy: While the manager needs to know who sent the items, they don't need to stare at the sender/consignee address all day. By making the Order Info section collapsible (default mode), this gives more vertical real estate to the Shipment Info, which contains the real-time operational data they actually act upon.
- 2. Shift to Individual Package Tracking: The UI transitions from a list of packages to a dedicated shipment view, optimizing for granular operational tracking where every box matters on its own. Previously, a "Shipment" status was likely an average or an aggregate (e.g., "Partially Shipped"). Now, status is binary and precise for that specific box (e.g., "Out for Delivery").
7
Reflections
- Designing for Data Logic, Not Just Layout: This project taught me that UI is only as strong as its underlying data structure. When the business redefined a “shipment” from a group of packages to an individual unit, it wasn’t just a label change—it required a total overhaul of the information hierarchy. By designing for the segment part, I learned that UX must be flexible enough to handle the ‘messiness’ of real-world data—where one shipment might be a simple A-to-B trip while another is a 5-segment international journey.
- Designing for Scalability: I learned to build flexible, modular components that could survive a major business pivot. When the definition of a “shipment” changed, our design system allowed us to reconfigure the layout without a total rebuild.
- Balancing Granularity with Clarity: High-density data doesn’t have to be overwhelming. I learned the value of progressive disclosure—using collapsible sections for secondary “Order” info—to keep the user focused on the immediate task: the individual package.
8
Next Steps
- Validation through Analytics: Measure “Time-to-completion” for operations managers to validate if the granular shipment view actually speeds up the processing and quantify the efficiency gains of this more granular focus.
- Edge Case Stress Testing: Iterate on the logic for Split Shipments and Consolidation to ensure the 1:1 model remains robust during complex logistics scenarios.